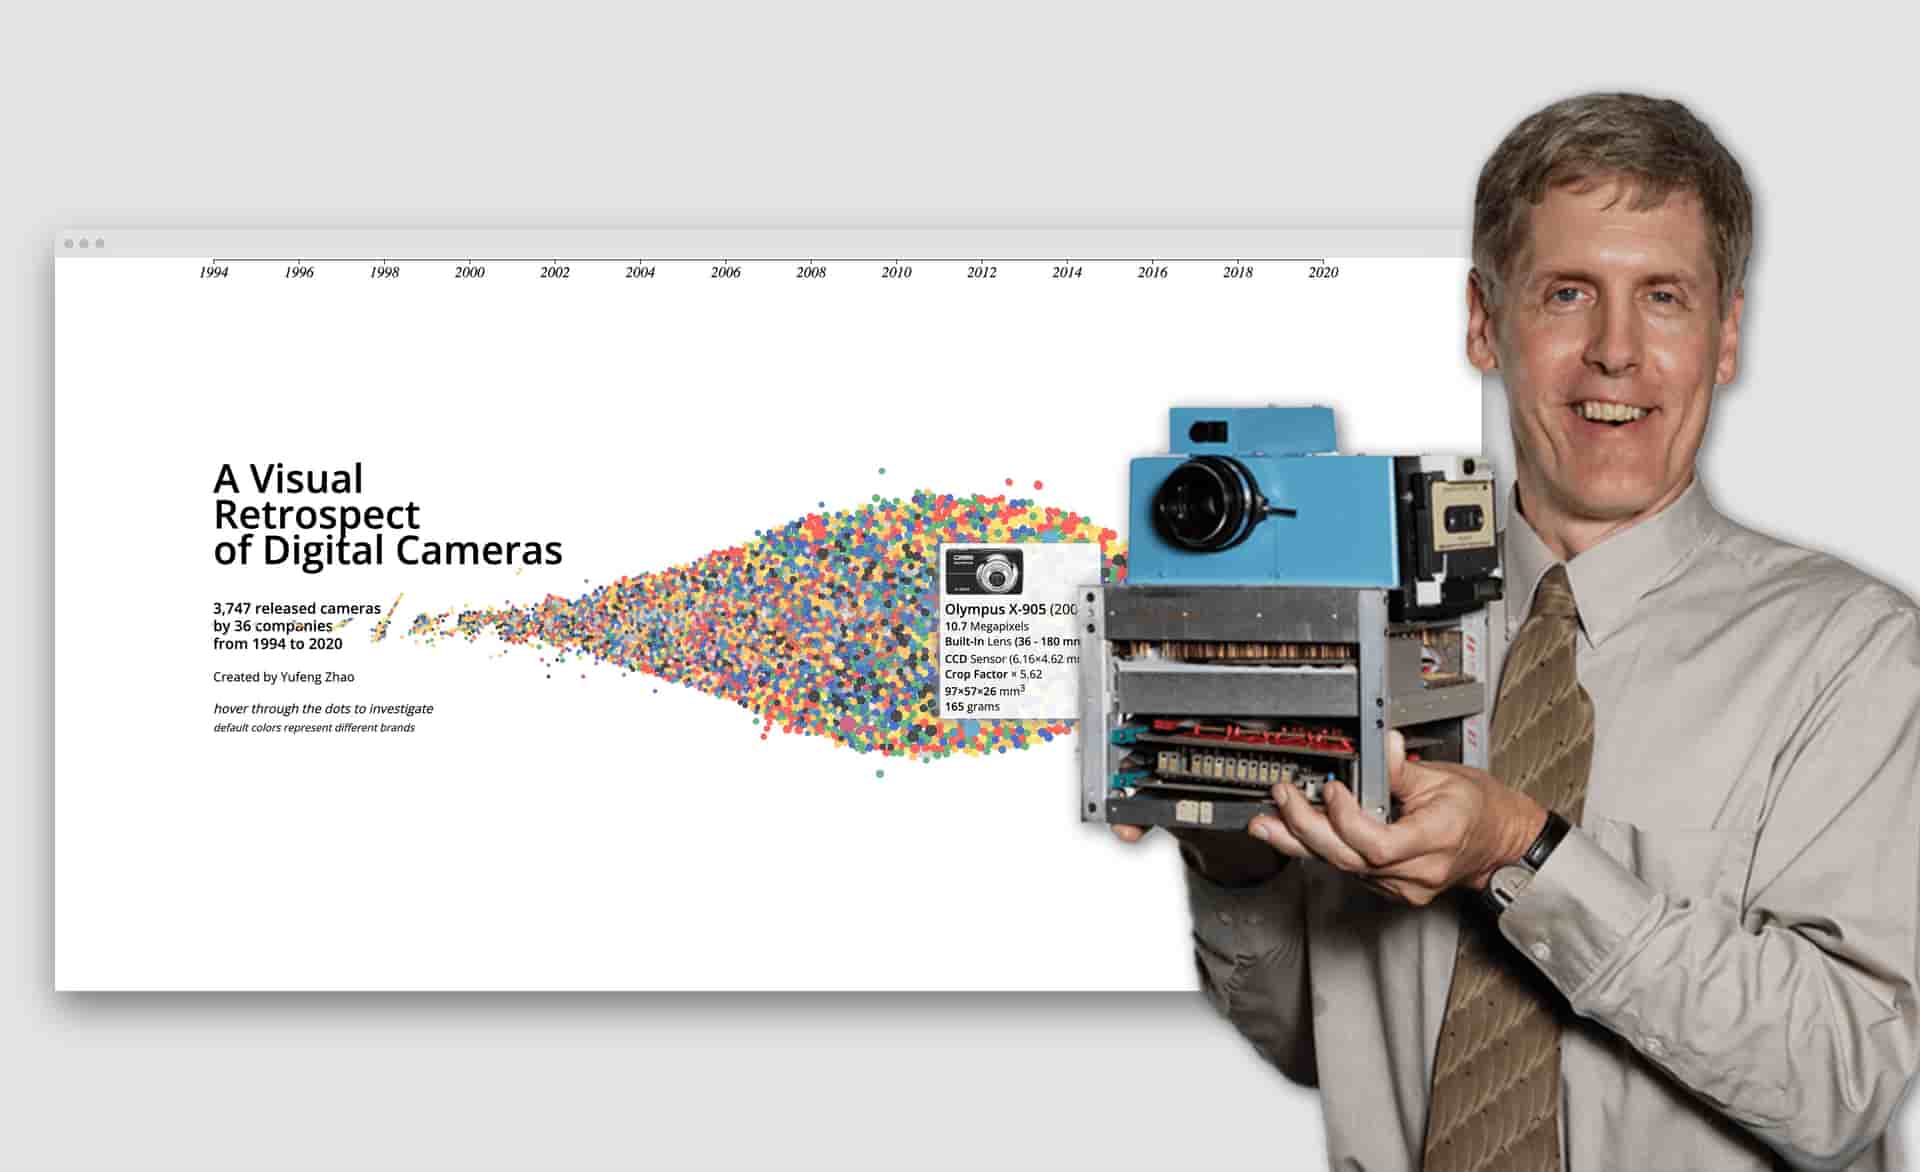
What can 26 years of camera specifications tell us about the evolution of digital photography?
Project Overview
This interactive data visualization chronicles the transformation of digital photography through the lens of technical specifications. By analyzing nearly 4,000 cameras released between 1994 and 2020, it uncovers the technological trends, market shifts, and engineering breakthroughs that shaped how we capture images.
Key Insights
The Smartphone Disruption

The Full-Frame Revolution
Technical Milestones
Resolution Race
Sony a7R IV's 61MP sensor marking the resolution peak
Sensor Evolution
CMOS technology's complete dominance over CCD by 2020
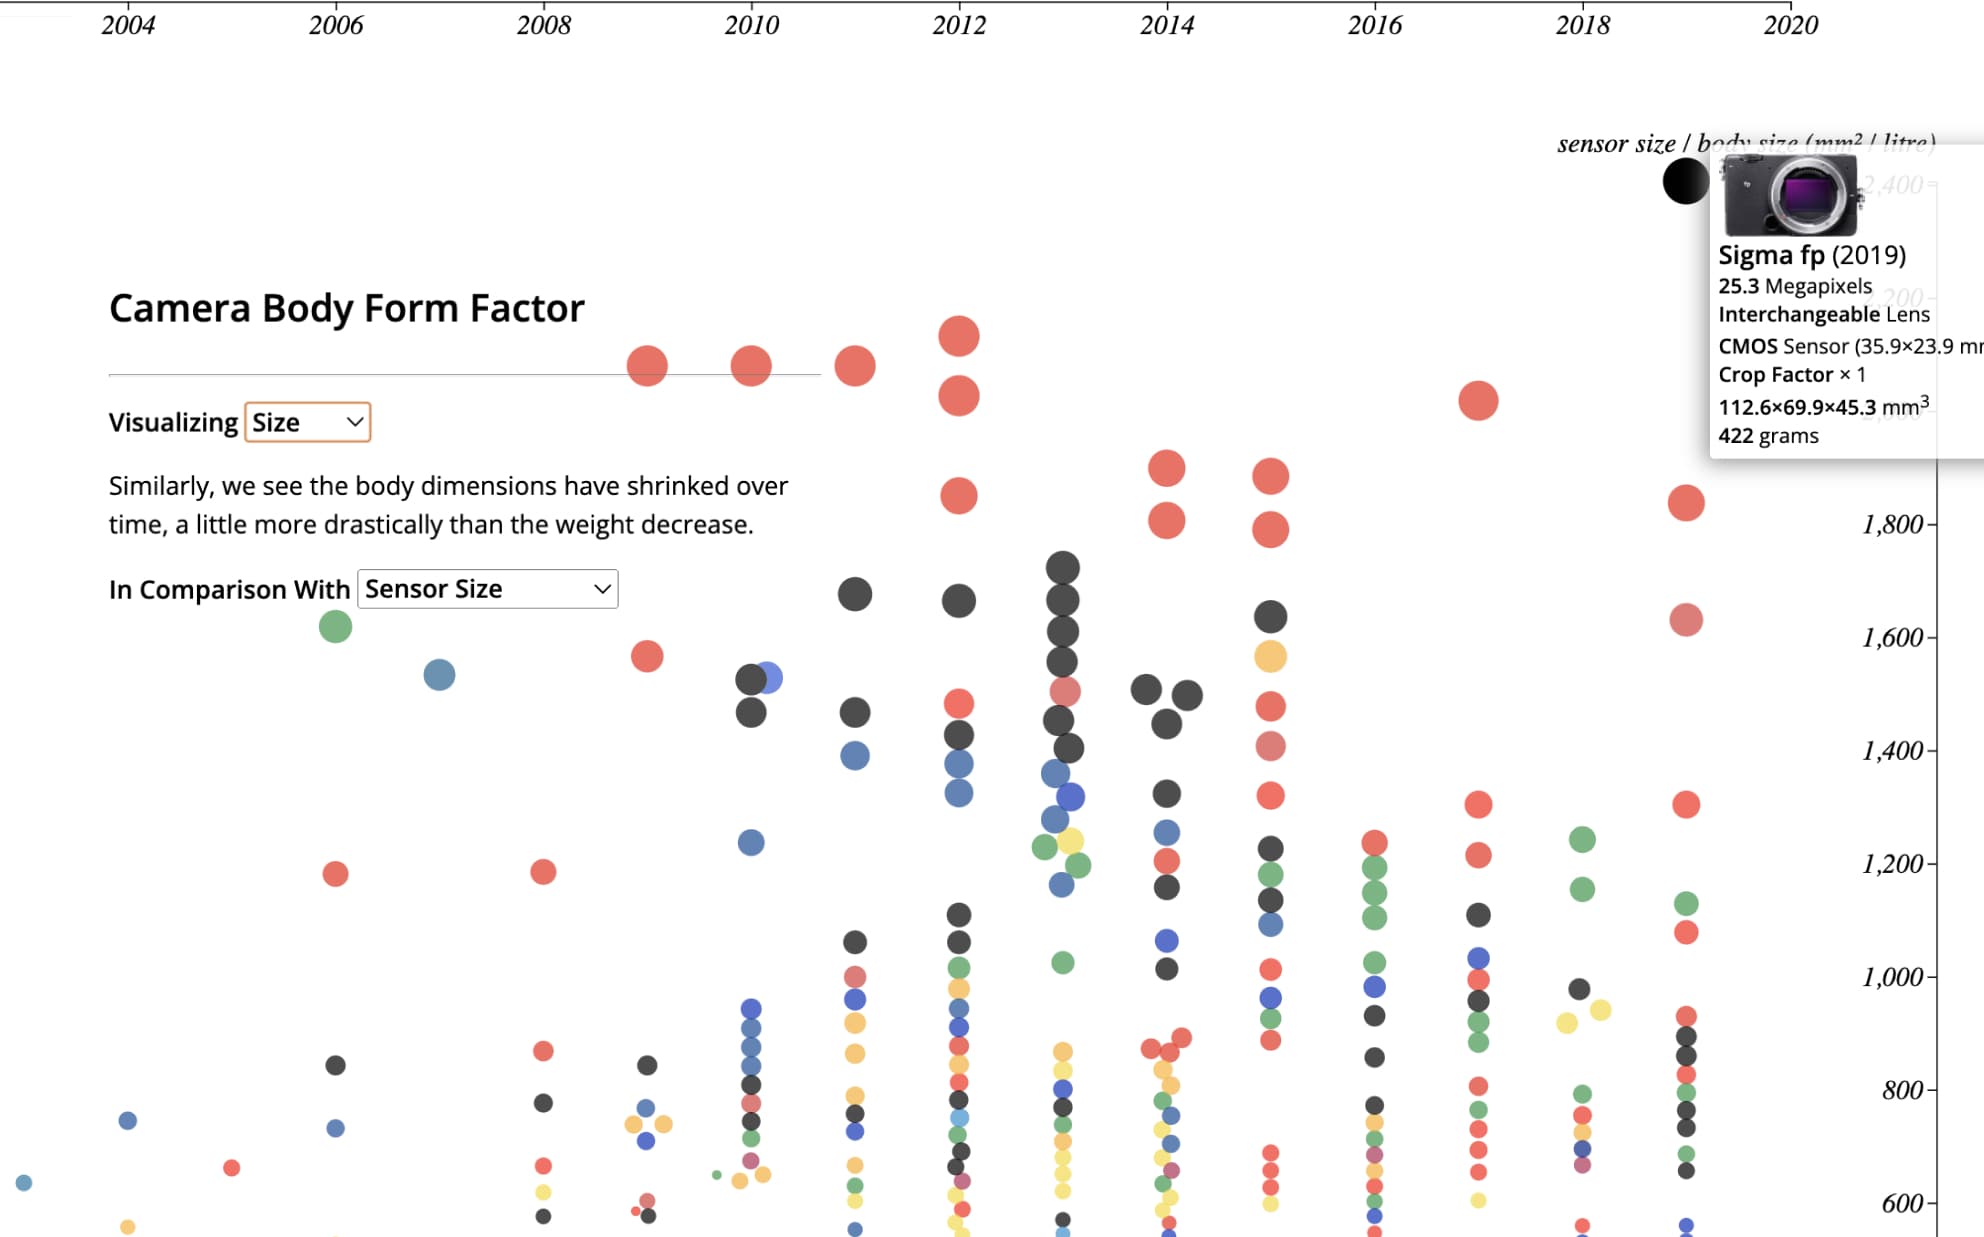
Size Trends
The disappearance of ultra-compact sensors post-smartphone era
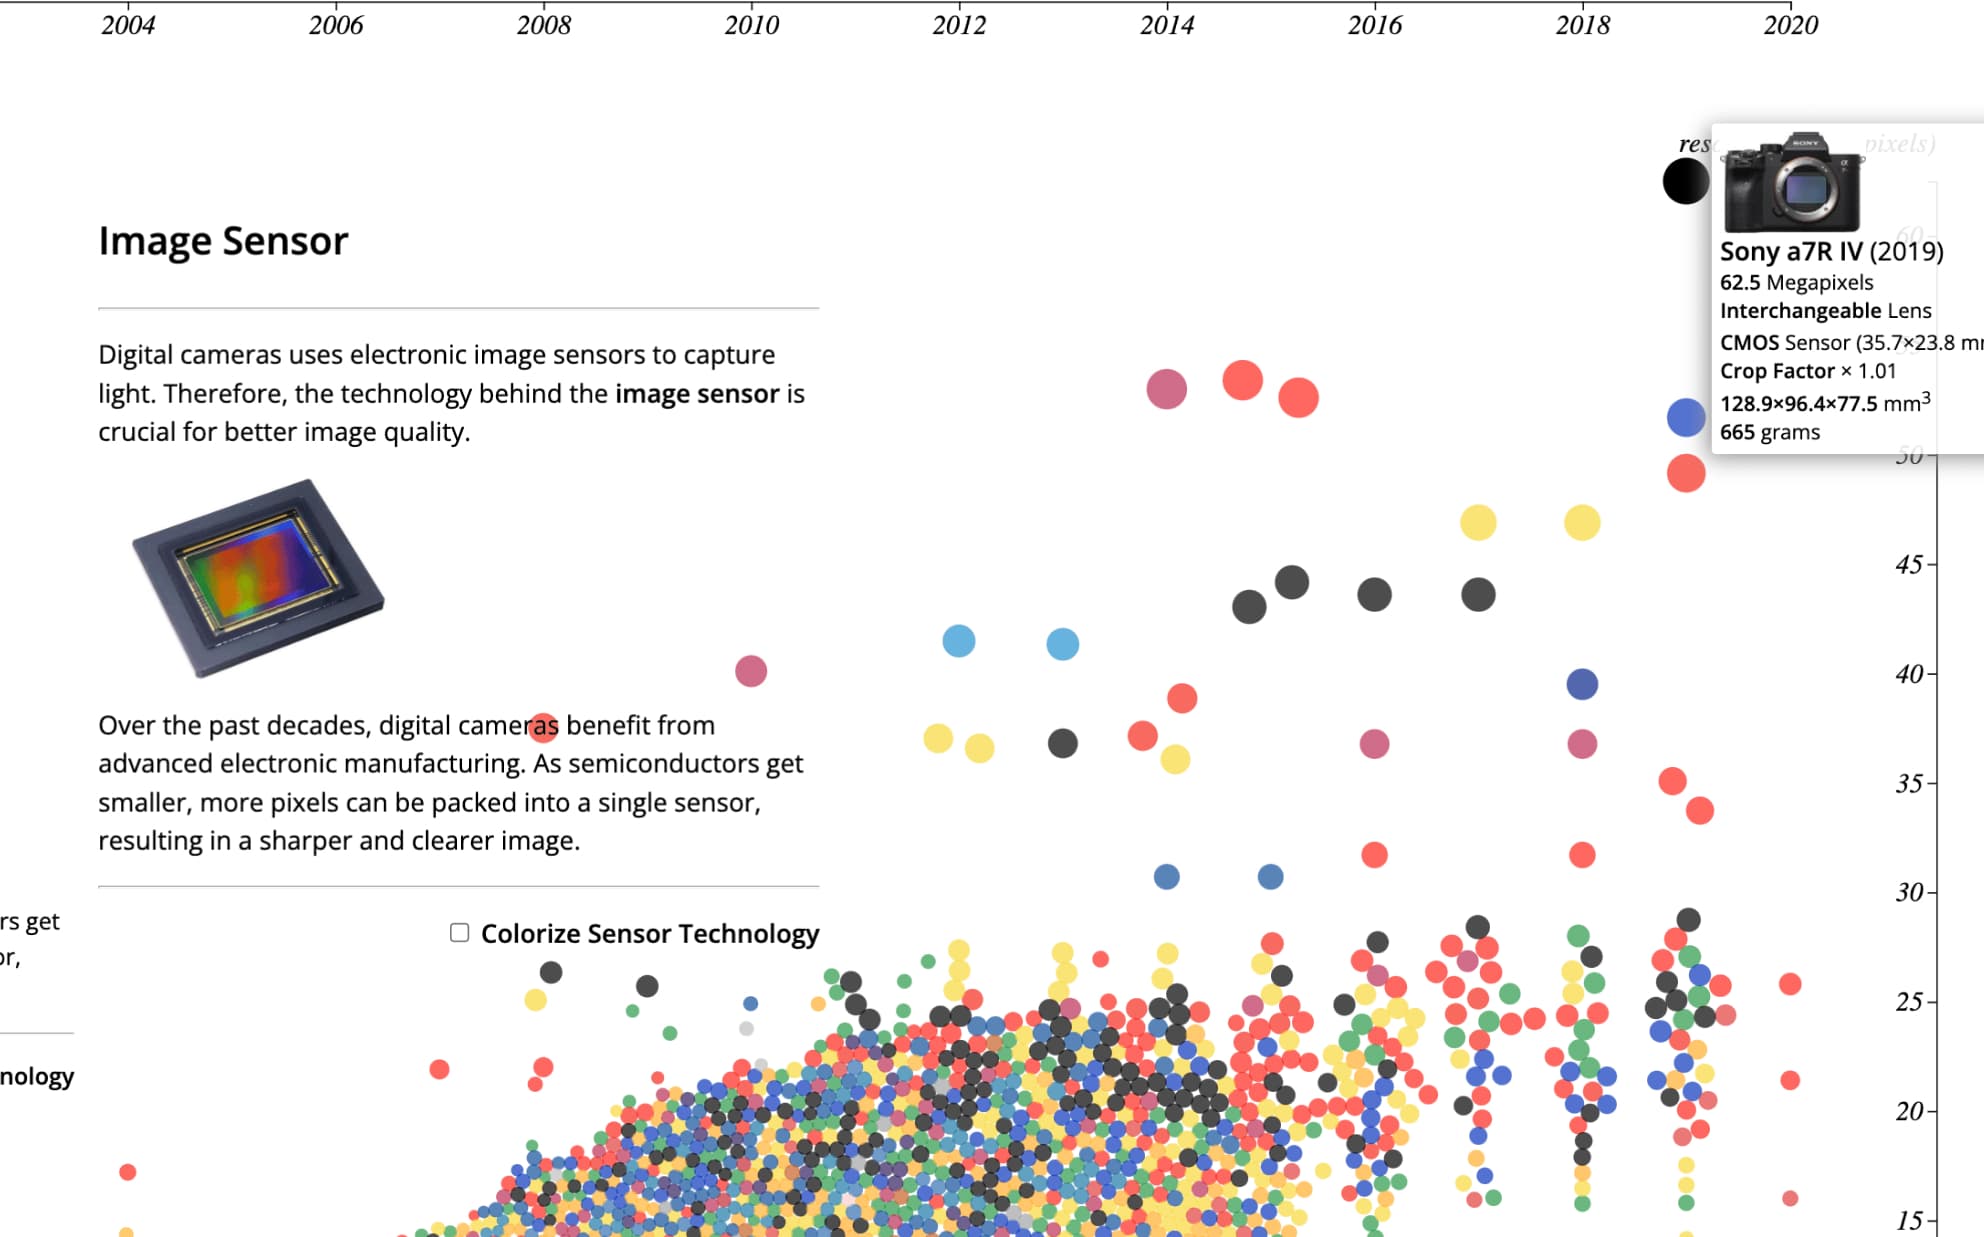 Sensor resolution
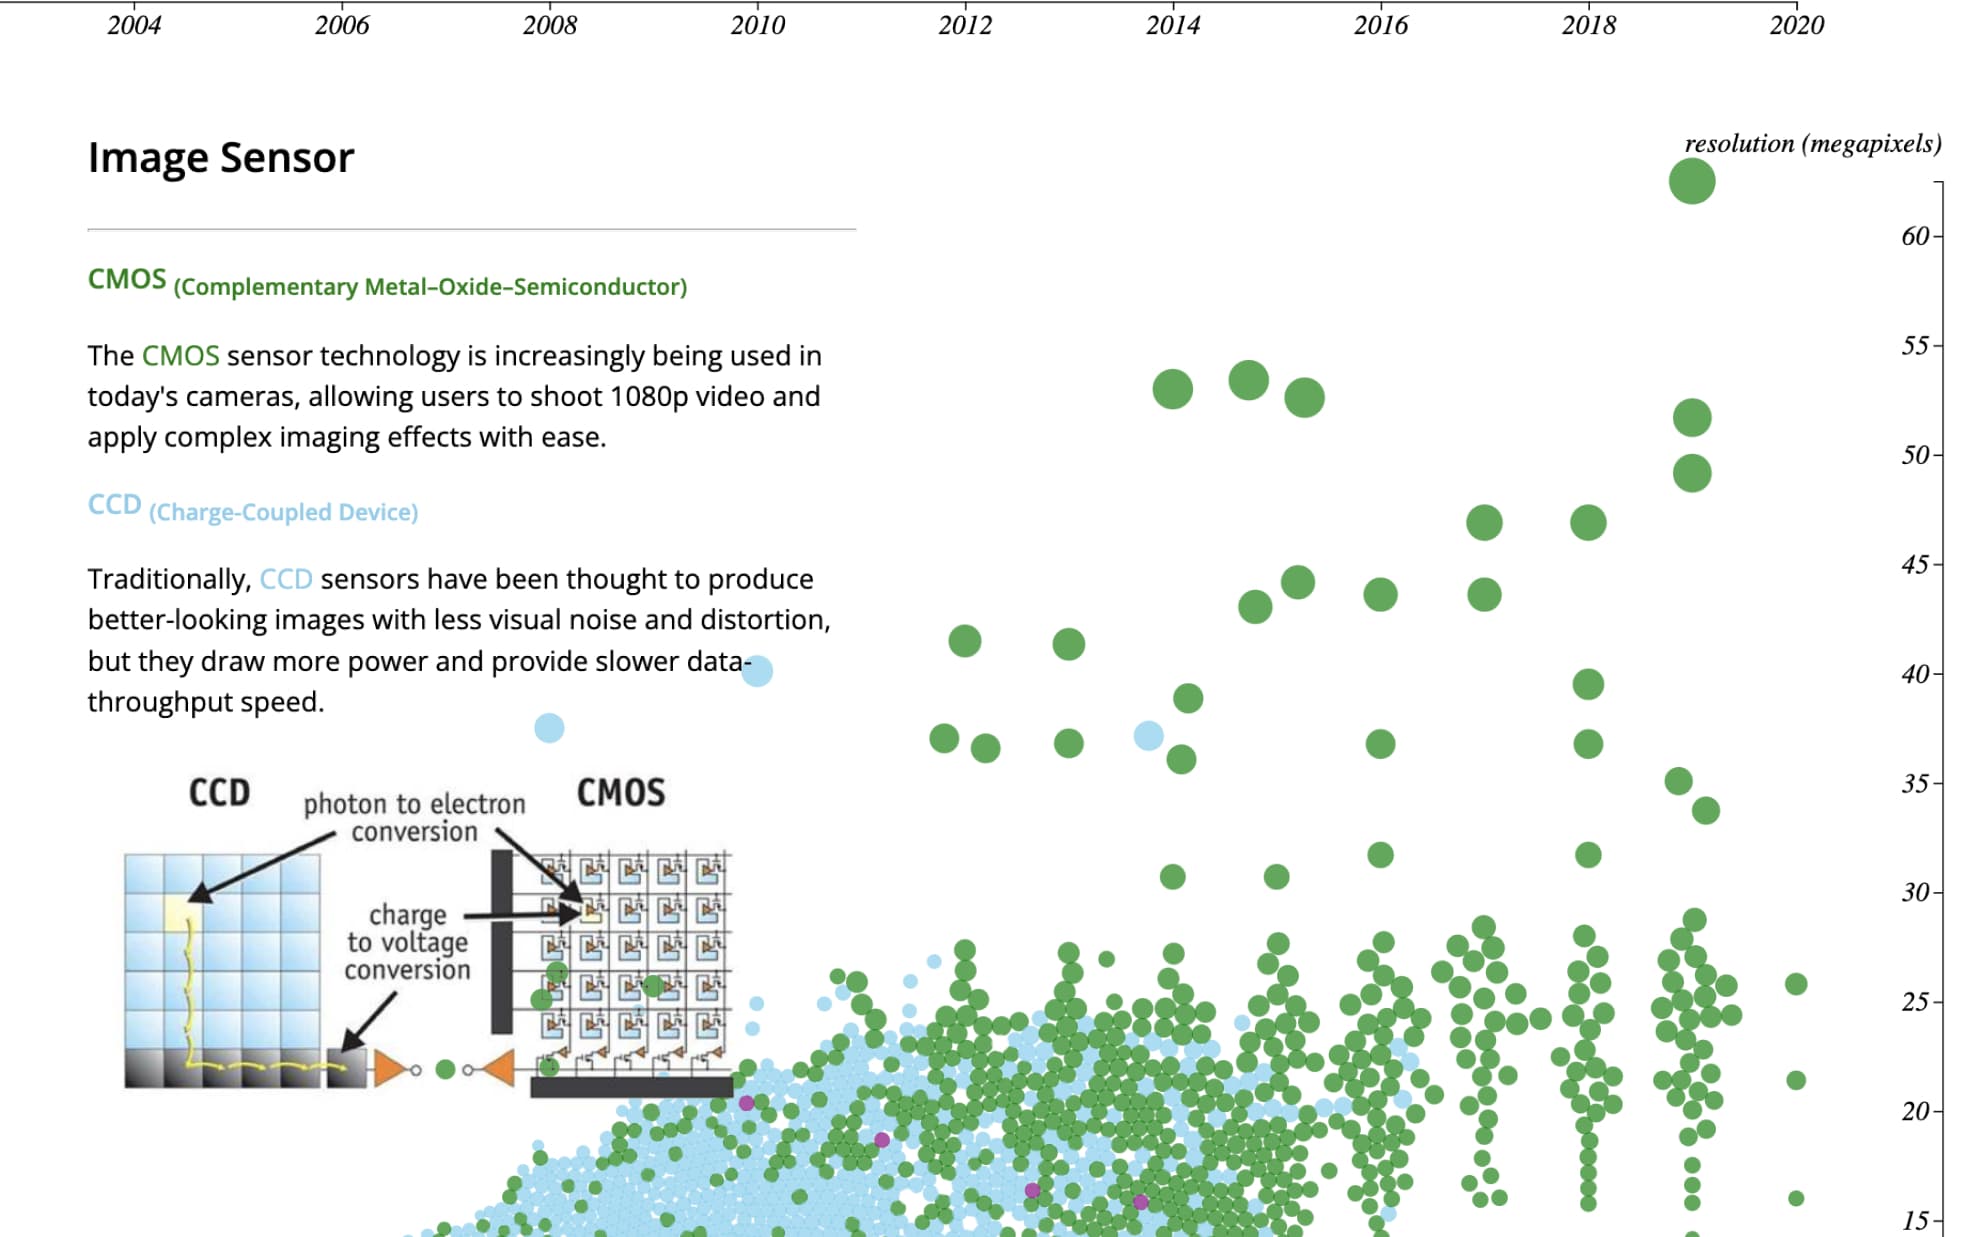 Sensor type
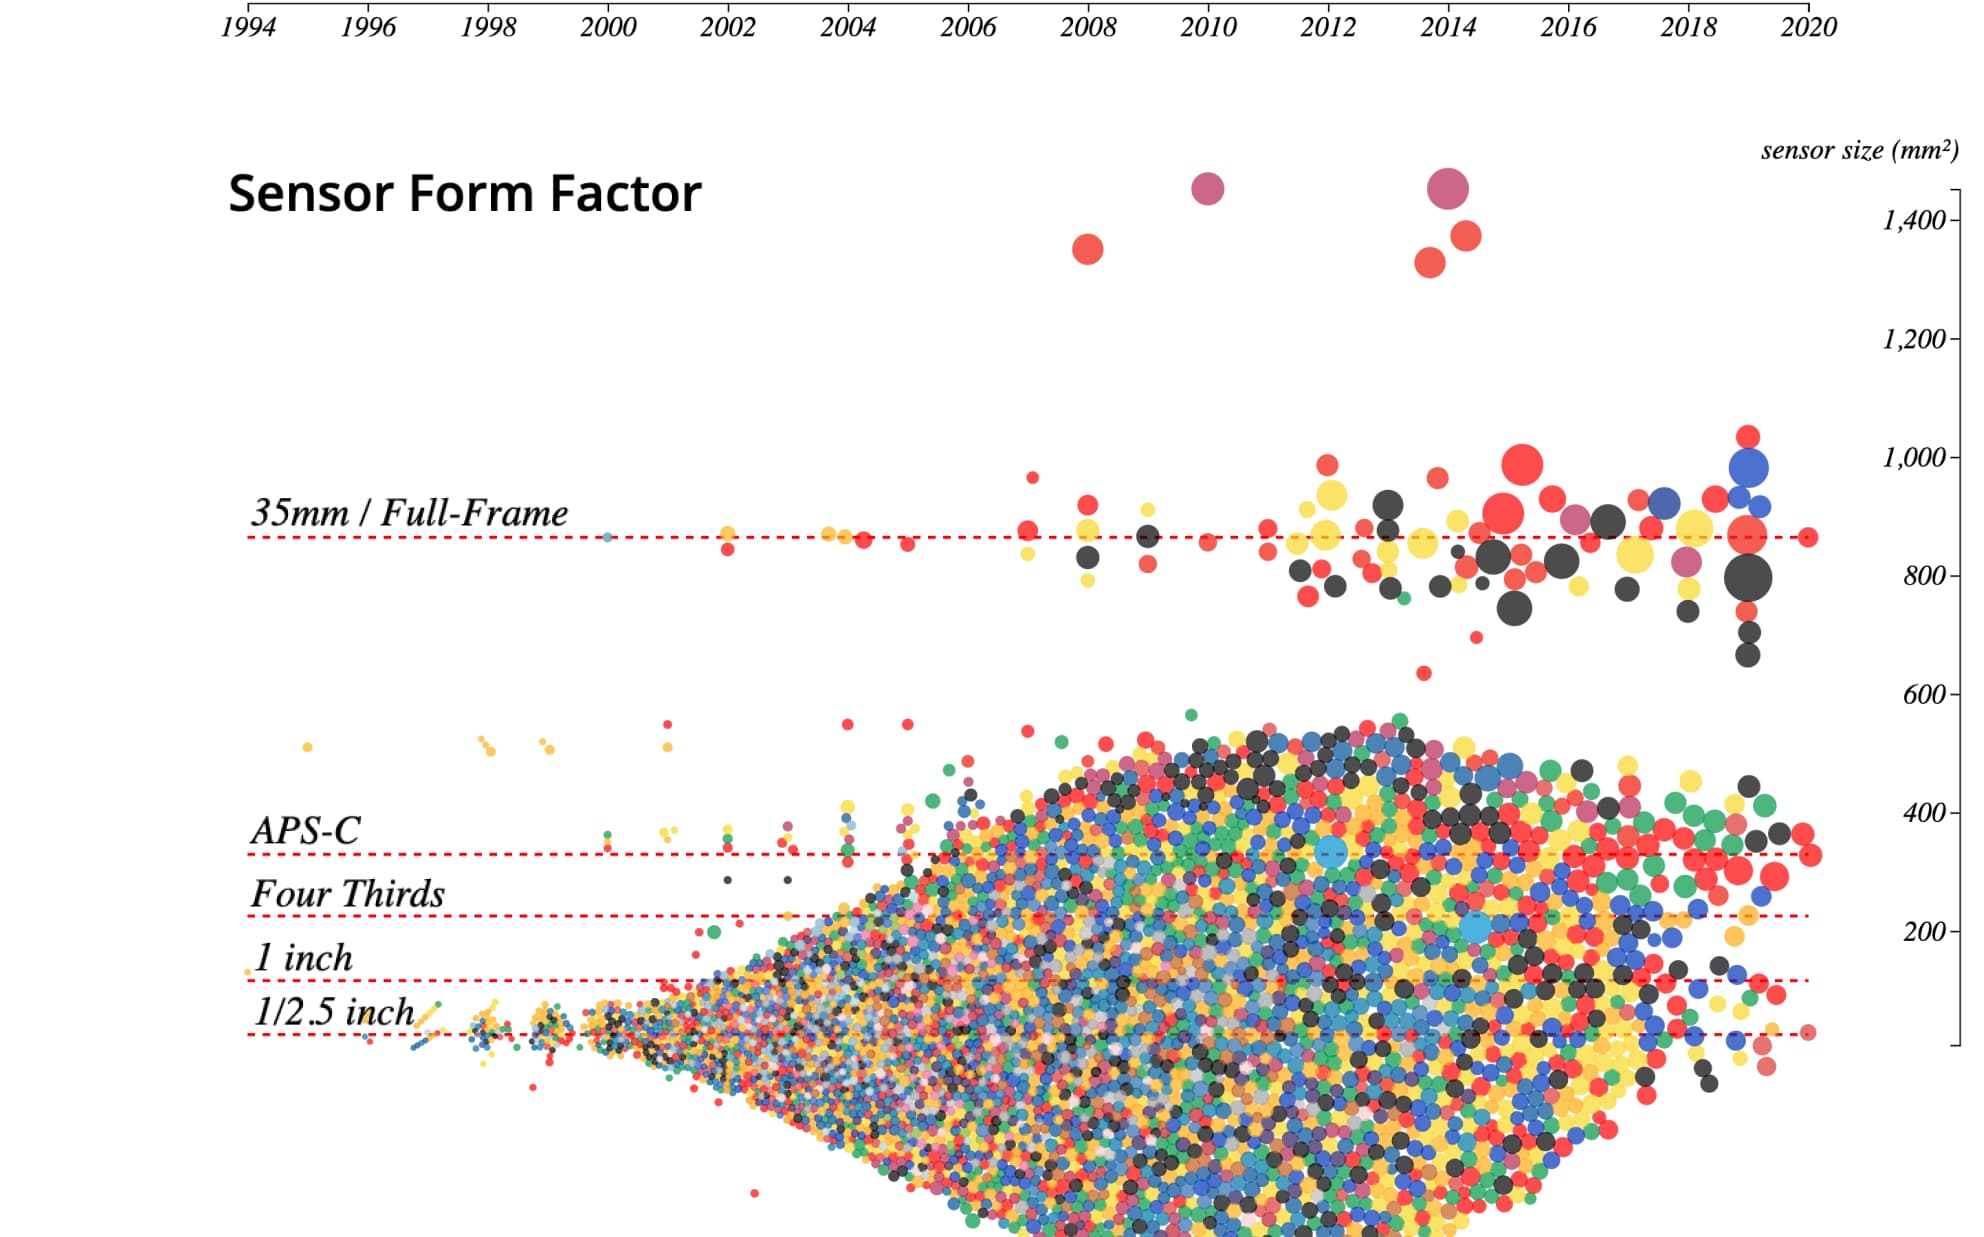 Sensor form factor
Technical Correlations
The analysis revealed several interesting technical relationships:
Screen & Connectivity
Higher resolution screens correlate with advanced USB versions
Sensor & Flash
Larger sensors consistently pair with external flash support
Weight & Features
Lighter cameras prioritize built-in flash convenience
 Screen resolution & USB version
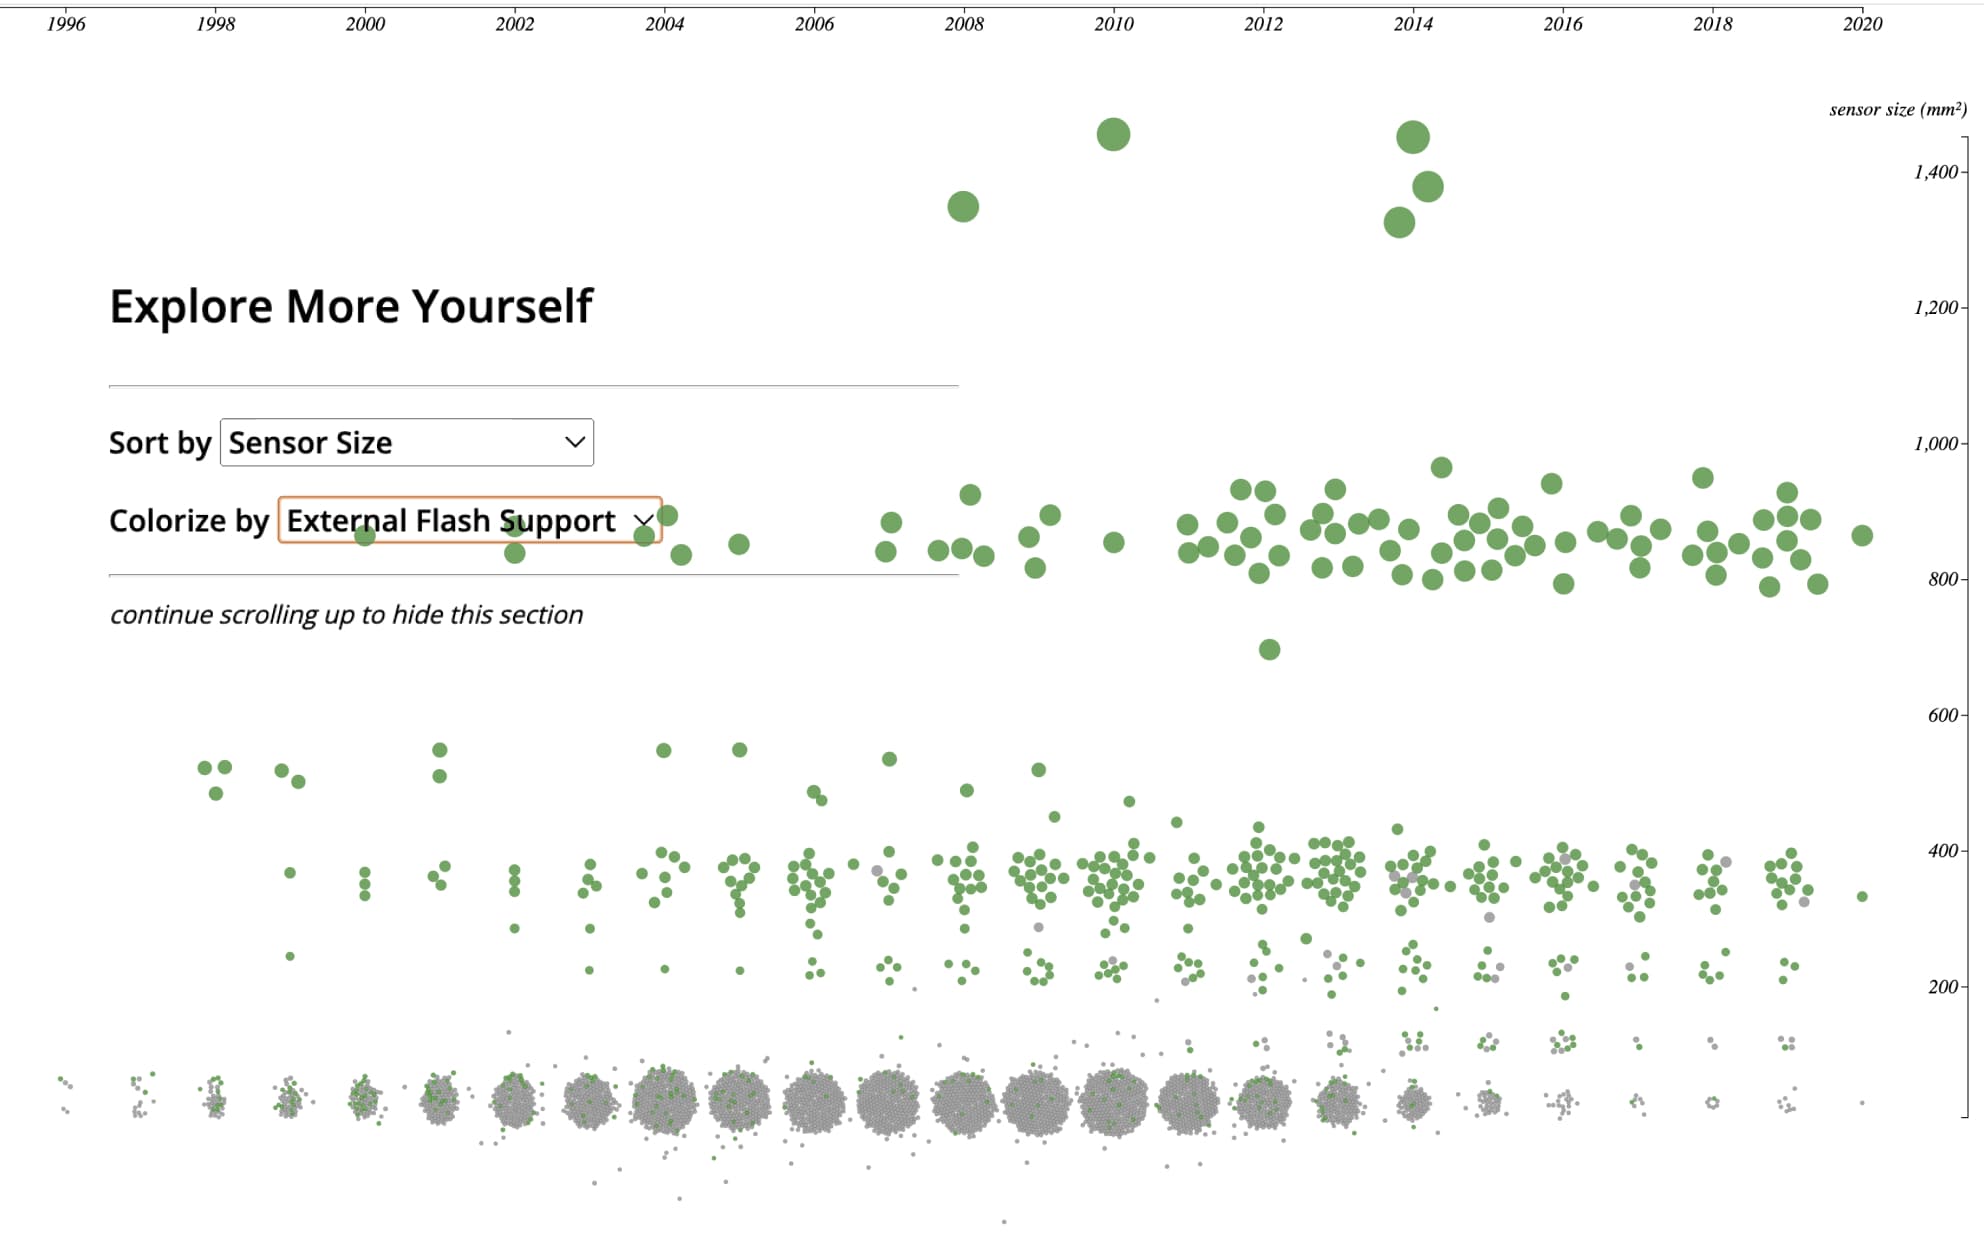 Sensor size & external flash
 Weight & internal flash
Data Architecture
Data Collection
The dataset was scraped from Digital Camera Database using custom Python scripts (available on GitHub). The raw data includes both core metrics and technical features of the cameras.
Core Metrics
Brand & Model
Release Year
Sensor Specifications
Physical Dimensions
Technical Features
Display Specifications
Connectivity Options
Photography Features
Power Systems
Visualization Framework
The visualization uses D3.js with scroll-based animations to transition between different metrics. As users scroll through the narrative, the visualization smoothly morphs between different views of the dataset, helping to emphasize key patterns in camera evolution.
Interactive Features
The visualization allows users to:
Timeline Tracking
Track technological evolution through animated timelines
Spec Comparison
Compare multiple specifications simultaneously
Pattern Analysis
Identify correlations between different features
Detailed View
Explore individual camera models in detail
Acknowledgments
This project was developed under Critical Data & Visualization at NYU Shanghai, taught by Leon Eckert.
The complete dataset and visualization code are available on GitHub.
